

Competition in the Express Entry pool has continued to ease for a second consecutive month, as thousands of high-scoring candidates exited the pool.
Since the beginning of the year, a total of 4,672 profiles with Comprehensive Ranking System (CRS) scores between 501 and 600 have left the pool. This decline is largely due to the substantial Canadian Experience Class (CEC) draw on January 7.
Book Your Consultation for Canadian Immigration
As the number of top-ranking candidates decreases, applicants with lower CRS scores now have improved chances of receiving an Invitation to Apply (ITA). With fewer high-scoring profiles in the pool, CRS cut-off scores are more likely to decline as the overall distribution of candidates shifts.
Current composition of the Express Entry pool
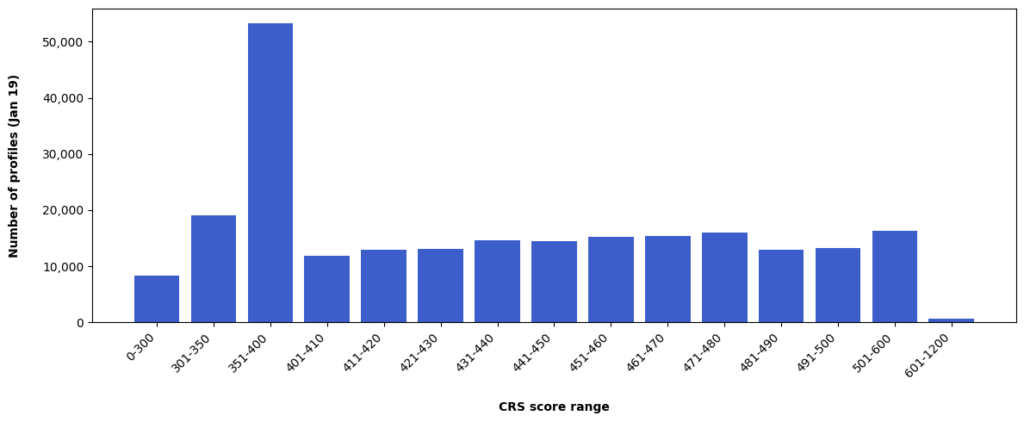
The table below outlines the current distribution of candidates in the Express Entry pool as of January 19, compared with figures from January 4, the most recent data available prior to this date.
| CRS score range | Distribution (Jan 4) | Distribution (Jan 19) | Difference |
|---|---|---|---|
| 0–300 | 8,125 | 8,269 | +144 |
| 301–350 | 18,745 | 19,062 | +317 |
| 351–400 | 52,469 | 53,221 | +752 |
| 401–410 | 11,438 | 11,858 | +420 |
| 411–420 | 12,442 | 12,863 | +421 |
| 421–430 | 12,816 | 13,092 | +276 |
| 431–440 | 14,285 | 14,571 | +286 |
| 441–450 | 14,139 | 14,452 | +313 |
| 451–460 | 14,835 | 15,209 | +374 |
| 461–470 | 14,881 | 15,320 | +439 |
| 471–480 | 15,435 | 15,965 | +530 |
| 481–490 | 12,499 | 12,942 | +443 |
| 491–500 | 12,873 | 13,278 | +405 |
| 501–600 | 21,013 | 16,341 | –4,672 |
| 601–1200 | 559 | 677 | +118 |
| Total | 236,554 | 237,120 | +566 |
The reduction in the 501–600 CRS range this month exceeded the decrease seen in December, when 4,622 profiles from the same range exited the pool.
Notably, this was the only score range to experience a decline. All other CRS bands saw modest increases, resulting in a net growth of 566 profiles in the overall pool.
Because Express Entry draws prioritize the highest-ranking candidates first—including in category-based selections—the departure of top scorers has effectively made the pool less competitive, even as its total size has grown slightly.
(Graph: Distribution of Express Entry profiles by CRS score range)
How your Express Entry profile compares
The table below shows the number of candidates, percentage share, and percentile ranking for each CRS score range as of January 19.
Percentile ranges represent the proportion of candidates with CRS scores at or below a given range. For example, a profile in the 95th–99th percentile ranks among the top 1–5% of all candidates in the pool. Percentiles are calculated using both the lower and upper limits of each CRS score band.
| CRS score range | Number of candidates | Percentile range | Percentage |
|---|---|---|---|
| 0–300 | 8,269 | 0.00%–3.49% | 3.49% |
| 301–350 | 19,062 | 3.49%–11.53% | 8.04% |
| 351–400 | 53,221 | 11.53%–33.97% | 22.44% |
| 401–410 | 11,858 | 33.97%–38.97% | 5.00% |
| 411–420 | 12,863 | 38.97%–44.40% | 5.42% |
| 421–430 | 13,092 | 44.40%–49.92% | 5.52% |
| 431–440 | 14,571 | 49.92%–56.06% | 6.14% |
| 441–450 | 14,452 | 56.06%–62.16% | 6.09% |
| 451–460 | 15,209 | 62.16%–68.57% | 6.41% |
| 461–470 | 15,320 | 68.57%–75.03% | 6.46% |
| 471–480 | 15,965 | 75.03%–81.77% | 6.73% |
| 481–490 | 12,942 | 81.77%–87.22% | 5.46% |
| 491–500 | 13,278 | 87.22%–92.82% | 5.60% |
| 501–600 | 16,341 | 92.82%–99.71% | 6.89% |
| 601–1200 | 677 | 99.71%–100.00% | 0.29% |
| Total | 237,120 |
This breakdown helps candidates better assess their relative position in the Express Entry pool and understand how competitive their CRS score is under current conditions.
[cikh_newsletter]